What are the key freight statistics by state?
- Whether a state ships more freight than it receives depends on the unit you count: in the 2022 CFS estimates, value and weight point in opposite directions for 17 of 47 states. This calculation uses U.S. Census Bureau and Bureau of Transportation Statistics Tables A7 and A8 for the 47 states with both weights published; it describes the estimates, not a test of statistical significance. 1
- Establishments in CFS-covered industries shipped an estimated 12.17 billion short tons worth $18.0 trillion in 2022—the published weight estimate was 2.4% lower than in 2017 while nominal value was 24.0% higher. Source: U.S. Census Bureau and Bureau of Transportation Statistics, 2022 CFS, Table A1b; January 2026 publication. 1
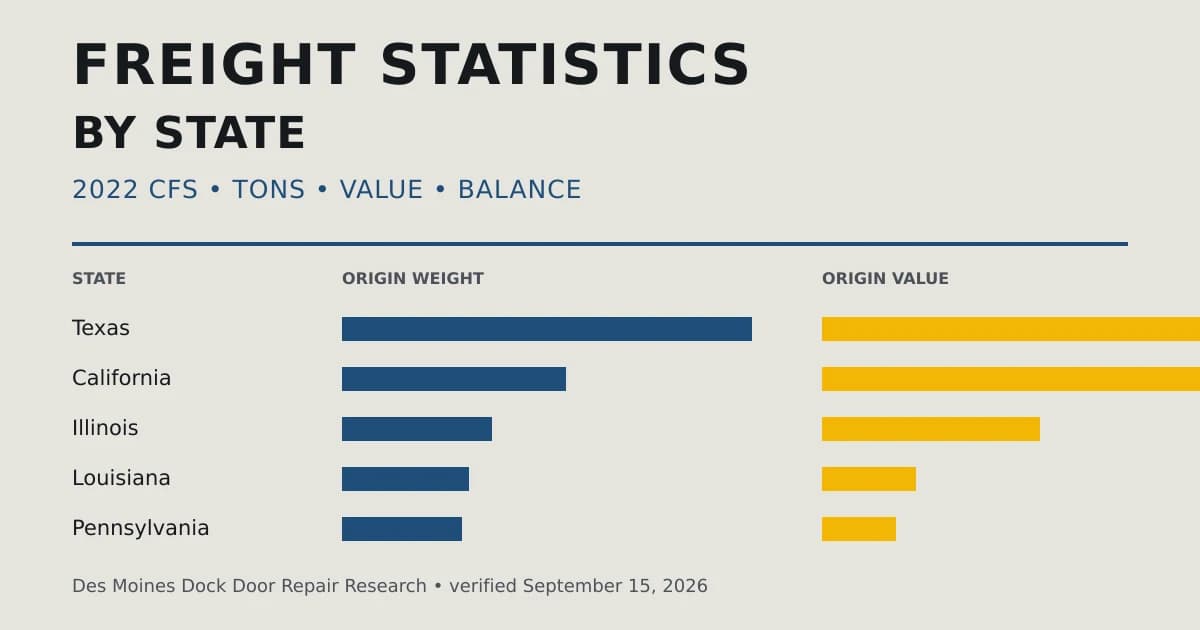
- Texas had the largest published state origin-weight estimate in the 2022 CFS: 1.666 billion short tons, or 13.7% of the CFS national total. Source: U.S. Census Bureau and Bureau of Transportation Statistics, Table A7; weights for three states were withheld. 1
- California had the largest state origin-value estimate in the 2022 CFS: $2.061 trillion, or 11.5% of the CFS national total. Source: U.S. Census Bureau and Bureau of Transportation Statistics, Table A7; value estimates are published for all 50 states. 1
- California and Texas together accounted for 22.8% of the estimated shipment value covered by the 2022 CFS—$4.098 trillion. Calculation: Des Moines Dock Door Repair Research, from U.S. Census Bureau and Bureau of Transportation Statistics Table A7. 1
- Cargo value averaged $1,479 per short ton in the 2022 CFS, compared with $1,164 in 2017, using each year’s current dollars. Calculation: Des Moines Dock Door Repair Research, from U.S. Census Bureau and Bureau of Transportation Statistics Table A1b; these are goods values, not shipping rates. 1 9
- Among the 47 states with published origin weights, the highest 2022 CFS cargo value per short ton was 18.7 times the lowest: $2,863 in Massachusetts versus $153 in Wyoming. DC, excluded from the state comparison, was $13,260. Calculation: Des Moines Dock Door Repair Research, from U.S. Census Bureau and Bureau of Transportation Statistics Table A7. 1
- Only 2 of the same 47 states—Illinois and Pennsylvania—had identical positions in the 2022 CFS value and weight rankings. Wyoming was 46th by value and 24th by weight, a 22-place gap in the published estimates. Calculation: Des Moines Dock Door Repair Research, from U.S. Census Bureau and Bureau of Transportation Statistics Table A7. 1
- Shipments with a great-circle distance below 50 miles accounted for 56.4% of estimated weight and 33.3% of value in the 2022 CFS. Source: U.S. Census Bureau and Bureau of Transportation Statistics, Table A2a; these are not routed-road distances. 1
- Truck shipments, including customer pick-up, represented 68.1% of estimated weight and 73.5% of value in the 2022 CFS, with a mean great-circle distance of 220 miles per shipment. Source: U.S. Census Bureau and Bureau of Transportation Statistics, Table A1a. 1
- Parcel, U.S. Postal Service and courier shipments represented 13.4% of estimated value but 0.5% of weight in the 2022 CFS. Source: U.S. Census Bureau and Bureau of Transportation Statistics, Table A1a; this is a category within multiple modes. 1
- The 2022 CFS does not estimate ton-miles; the preceding 2017 survey did. Sources: U.S. Census Bureau and Bureau of Transportation Statistics, 2022 CFS Subarea Estimates methodology, October 2025, and the Census Bureau’s 2017 CFS publication description. 4 18
- BTS keeps 2022 CFS great-circle distances separate from 2012 and 2017 GeoMiler distances in its data portal to discourage direct comparison of unlike measures. Source: Bureau of Transportation Statistics, CFS Data Explorer; documentation verified September 15, 2026. 5
- BTS says CFS typically supplies about 70% of FAF flows by value; a separate comparison of 2017 domestic flows found state outbound-weight coverage of 35%–80%. These are not newly calculated 2022 coverage percentages. Sources: Bureau of Transportation Statistics, FAF FAQs and its 2017 CFS–FAF comparison; verified September 15, 2026. 3 7 15
- Iowa originated an estimated 258.3 million short tons worth $261.2 billion in the 2022 CFS, ranking 17th by weight and 25th by value among the same 47 states. Calculation: Des Moines Dock Door Repair Research, from U.S. Census Bureau and Bureau of Transportation Statistics Table A7. 1
Scope note. These are 2022 Commodity Flow Survey estimates for the industries the survey covers—mining, manufacturing, wholesale trade, warehousing and selected retail and services—not totals for all U.S. freight. Values describe goods, not freight charges; one short ton is 2,000 pounds. The two state counts used throughout this page are 50 states for value-only comparisons and 47 states for weight and matched comparisons. The District of Columbia is shown in the dataset but excluded from state rankings. 1 9 11
By Des Moines Dock Door Repair Research
Last verified: September 15, 2026 · Data year: 2022 · Source print publication: January 2026 · Compilation version: 1.2
Most freight statistics by state answer a simpler question than people think. Ask whether a state ships more than it receives, and the answer changes depending on whether you count dollars or short tons—for 17 of the 47 states where the government publishes weights in both directions, the two measures point in opposite directions. Wyoming’s estimated origin weight was 2.95 times its destination weight, the highest published state ratio, while its origin value was about 64 cents for every dollar of destination value. Both totals include intrastate shipments, and the comparison describes the published estimates rather than proving a difference in the underlying population. 1
The U.S. Census Bureau and the Bureau of Transportation Statistics publish state freight origins on printed page 19 of their survey report and state freight destinations on page 20. We joined those tables, worked the arithmetic, and published the result below with every input traced back to its source. The federal agencies produced the estimates; the joined reference and calculations are ours. 1
On this page
Which states ship and receive the most freight · The full freight-by-state table · Why value and weight give different answers · Net shippers and net receivers · What these numbers measure and leave out · CFS or FAF · Three ways a freight statistic goes wrong · Modes and distance · Iowa and the Des Moines geography · What changed in 2026 · Methodology and reliability · Limitations · Verified and unreported figures · How to cite this page · Questions · Sources
Which states ship and receive the most freight?
Texas leads the published weight estimates and California leads the value estimates in the 2022 CFS. Texas originated an estimated 1.666 billion short tons—13.7% of CFS national weight and 1.83 times California’s weight—while California originated $2.061 trillion of goods, 11.5% of CFS national value. The five largest published state weight estimates account for 34.4% of CFS national weight, and the five largest state value estimates account for 35.9% of value. 1
Top 10 states by freight weight shipped, 2022
| Rank | State | Short tons shipped (thousands) | Share of CFS national weight |
|---|---|---|---|
| 1 | Texas | 1,666,484 | 13.69% |
| 2 | California | 909,997 | 7.48% |
| 3 | Illinois | 608,162 | 5.00% |
| 4 | Louisiana | 515,199 | 4.23% |
| 5 | Pennsylvania | 487,794 | 4.01% |
| 6 | Indiana | 434,874 | 3.57% |
| 7 | Ohio | 423,155 | 3.48% |
| 8 | Florida | 383,500 | 3.15% |
| 9 | New York | 332,501 | 2.73% |
| 10 | Missouri | 294,513 | 2.42% |
Source: U.S. Census Bureau and Bureau of Transportation Statistics, 2022 CFS, Table A7, printed page 19. Shares calculated from the official national estimate. Weight ranks compare 47 states; Alaska, Arizona and New Mexico are withheld, and DC is not a state. Verified September 15, 2026. 1
Top 10 states by freight value shipped, 2022
| Rank | State | Value shipped ($ millions) | Share of CFS national value |
|---|---|---|---|
| 1 | California | 2,060,567 | 11.45% |
| 2 | Texas | 2,037,039 | 11.32% |
| 3 | Illinois | 884,918 | 4.92% |
| 4 | Ohio | 780,121 | 4.33% |
| 5 | Pennsylvania | 701,623 | 3.90% |
| 6 | Florida | 684,193 | 3.80% |
| 7 | New York | 670,924 | 3.73% |
| 8 | Indiana | 624,977 | 3.47% |
| 9 | New Jersey | 594,208 | 3.30% |
| 10 | Georgia | 582,995 | 3.24% |
Source: U.S. Census Bureau and Bureau of Transportation Statistics, 2022 CFS, Table A7, printed page 19. Shares calculated from the official national estimate. Value-only ranks compare all 50 states and exclude DC. Verified September 15, 2026. 1
Eight states appear in both top tens, though not always in the same position. Louisiana is fourth by published weight and seventeenth by value. Georgia and New Jersey make the value list and neither makes the weight list. That is the problem with a single “biggest freight state” claim, and the next two sections take it apart. These rankings order estimates; they do not establish statistically significant differences between states. 1
What does the full freight-by-state table show?
This is the 2022 CFS reference for all 50 states and the District of Columbia: the published origin and destination estimates, joined with four calculated columns in the display below. The downloadable dataset also carries destination cargo value per ton, national shares, matched ranks, and all six published state coefficients of variation. “S” means Census withheld an estimate because it did not meet publication standards; it does not mean zero. 1
Value is in millions of current 2022 dollars. Weight is in thousands of short tons, so Iowa’s 258,251 reads as 258.251 million short tons. “Out” and “in” mean CFS origin and destination totals, including shipments within the same state, not exclusively interstate movements. “Avg mi out” is mean great-circle distance per originating shipment, not road or rail route mileage. 1 9
Dataset downloads: State CSV · Matching JSON · Reproducibility package, version 1.2.
The CSV and JSON contain the same 51 jurisdiction records. The package contains the source transcription, six reliability fields per jurisdiction, calculated fields, national controls, source register, data dictionary, supplementary mode and distance inputs, the ten-county geography crosswalk, and the working Python build script. Its verification date is September 15, 2026; it contains no county-level freight tonnage estimate.
Freight shipped and received by state, 2022
| State | Value out ($M) | Tons out (K) | $/ton out | Avg GCD mi out | Value in ($M) | Tons in (K) | Out/in value | Out/in weight | Net tons (K) |
|---|---|---|---|---|---|---|---|---|---|
| Alabama | 307,125 | 188,249 | 1,631 | 327 | 268,293 | 183,716 | 1.145 | 1.025 | +4,533 |
| Alaska | 25,376 | S | — | 814 | 53,014 | S | 0.479 | — | — |
| Arizona | 252,707 | S | — | 555 | 295,116 | S | 0.856 | — | — |
| Arkansas | 166,275 | 120,880 | 1,376 | 629 | 172,116 | 130,171 | 0.966 | 0.929 | −9,291 |
| California | 2,060,567 | 909,997 | 2,264 | 897 | 1,967,866 | 958,100 | 1.047 | 0.950 | −48,103 |
| Colorado | 230,579 | 118,235 | 1,950 | 349 | 260,407 | 149,584 | 0.885 | 0.790 | −31,349 |
| Connecticut | 188,093 | 72,115 | 2,608 | 295 | 154,548 | 118,536 | 1.217 | 0.608 | −46,421 |
| Delaware | 67,417 | 34,121 | 1,976 | 169 | 52,052 | 31,100 | 1.295 | 1.097 | +3,021 |
| District of Columbia | 3,872 | 292 | 13,260 | 824 | 14,683 | 3,215 | 0.264 | 0.091 | −2,923 |
| Florida | 684,193 | 383,500 | 1,784 | 519 | 897,350 | 440,702 | 0.762 | 0.870 | −57,202 |
| Georgia | 582,995 | 274,255 | 2,126 | 518 | 559,774 | 291,391 | 1.041 | 0.941 | −17,136 |
| Hawaii | 29,788 | 17,903 | 1,664 | 2,045 | 40,269 | 20,776 | 0.740 | 0.862 | −2,873 |
| Idaho | 83,174 | 69,725 | 1,193 | 669 | 117,247 | 72,769 | 0.709 | 0.958 | −3,044 |
| Illinois | 884,918 | 608,162 | 1,455 | 473 | 807,552 | 519,033 | 1.096 | 1.172 | +89,129 |
| Indiana | 624,977 | 434,874 | 1,437 | 485 | 531,258 | 383,604 | 1.176 | 1.134 | +51,270 |
| Iowa | 261,183 | 258,251 | 1,011 | 478 | 233,435 | 234,825 | 1.119 | 1.100 | +23,426 |
| Kansas | 223,335 | 176,237 | 1,267 | 404 | 184,587 | 160,697 | 1.210 | 1.097 | +15,540 |
| Kentucky | 359,912 | 286,001 | 1,258 | 495 | 347,771 | 247,281 | 1.035 | 1.157 | +38,720 |
| Louisiana | 380,212 | 515,199 | 738 | 297 | 420,837 | 547,364 | 0.903 | 0.941 | −32,165 |
| Maine | 52,441 | 54,137 | 969 | 636 | 73,406 | 38,497 | 0.714 | 1.406 | +15,640 |
| Maryland | 198,615 | 101,897 | 1,949 | 365 | 216,994 | 133,488 | 0.915 | 0.763 | −31,591 |
| Massachusetts | 371,877 | 129,890 | 2,863 | 747 | 325,526 | 144,071 | 1.142 | 0.902 | −14,181 |
| Michigan | 578,424 | 290,087 | 1,994 | 452 | 626,045 | 314,635 | 0.924 | 0.922 | −24,548 |
| Minnesota | 414,173 | 293,581 | 1,411 | 692 | 340,087 | 247,176 | 1.218 | 1.188 | +46,405 |
| Mississippi | 153,310 | 144,094 | 1,064 | 353 | 163,412 | 133,558 | 0.938 | 1.079 | +10,536 |
| Missouri | 365,669 | 294,513 | 1,242 | 555 | 350,717 | 229,255 | 1.043 | 1.285 | +65,258 |
| Montana | 43,325 | 62,362 | 695 | 487 | 72,561 | 46,317 | 0.597 | 1.346 | +16,045 |
| Nebraska | 144,722 | 174,874 | 828 | 546 | 121,040 | 152,295 | 1.196 | 1.148 | +22,579 |
| Nevada | 97,668 | 35,514 | 2,750 | 729 | 117,898 | 60,204 | 0.828 | 0.590 | −24,690 |
| New Hampshire | 61,287 | 26,134 | 2,345 | 778 | 77,853 | 34,080 | 0.787 | 0.767 | −7,946 |
| New Jersey | 594,208 | 271,226 | 2,191 | 359 | 504,727 | 224,356 | 1.177 | 1.209 | +46,870 |
| New Mexico | 39,216 | S | — | 240 | 73,939 | S | 0.530 | — | — |
| New York | 670,924 | 332,501 | 2,018 | 515 | 744,457 | 380,684 | 0.901 | 0.873 | −48,183 |
| North Carolina | 530,707 | 270,288 | 1,963 | 569 | 484,563 | 288,014 | 1.095 | 0.938 | −17,726 |
| North Dakota | 61,206 | 167,961 | 364 | 349 | 85,336 | 164,503 | 0.717 | 1.021 | +3,458 |
| Ohio | 780,121 | 423,155 | 1,844 | 526 | 702,383 | 492,709 | 1.111 | 0.859 | −69,554 |
| Oklahoma | 173,035 | 177,299 | 976 | 420 | 183,824 | 159,162 | 0.941 | 1.114 | +18,137 |
| Oregon | 270,840 | 116,412 | 2,327 | 655 | 208,443 | 117,633 | 1.299 | 0.990 | −1,221 |
| Pennsylvania | 701,623 | 487,794 | 1,438 | 455 | 686,660 | 501,557 | 1.022 | 0.973 | −13,763 |
| Rhode Island | 34,403 | 15,348 | 2,242 | 515 | 32,411 | 14,191 | 1.061 | 1.082 | +1,157 |
| South Carolina | 254,641 | 128,457 | 1,982 | 575 | 260,850 | 124,344 | 0.976 | 1.033 | +4,113 |
| South Dakota | 53,220 | 77,316 | 688 | 395 | 56,724 | 80,578 | 0.938 | 0.960 | −3,262 |
| Tennessee | 437,049 | 225,456 | 1,939 | 420 | 450,317 | 260,688 | 0.971 | 0.865 | −35,232 |
| Texas | 2,037,039 | 1,666,484 | 1,222 | 378 | 2,169,299 | 1,783,127 | 0.939 | 0.935 | −116,643 |
| Utah | 272,699 | 192,785 | 1,415 | 722 | 219,771 | 135,410 | 1.241 | 1.424 | +57,375 |
| Vermont | 24,331 | 25,550 | 952 | 516 | 29,759 | 29,127 | 0.818 | 0.877 | −3,577 |
| Virginia | 282,292 | 208,080 | 1,357 | 453 | 326,902 | 207,925 | 0.864 | 1.001 | +155 |
| Washington | 386,730 | 145,685 | 2,655 | 346 | 430,253 | 179,271 | 0.899 | 0.813 | −33,586 |
| West Virginia | 71,171 | 195,000 | 365 | 350 | 82,083 | 118,909 | 0.867 | 1.640 | +76,091 |
| Wisconsin | 395,529 | 221,741 | 1,784 | 479 | 357,026 | 211,942 | 1.108 | 1.046 | +9,799 |
| Wyoming | 27,590 | 180,283 | 153 | 558 | 43,335 | 61,221 | 0.637 | 2.945 | +119,062 |
| United States | 17,996,782 | 12,169,793 | 1,479 | 552 | 17,996,782 | 12,169,793 | — | — | — |
Source: U.S. Census Bureau and Bureau of Transportation Statistics, 2022 Commodity Flow Survey, EC22TCF-US, Tables A7 (origin state) and A8 (destination state), published January 2026. Dollars per ton, out/in ratios and net tons derived by Des Moines Dock Door Repair Research. Verified September 15, 2026. 1
A caution that belongs right next to this table: do not add the value-out and value-in columns together as a count of distinct shipments. Within a state, both columns include shipments that started and finished inside that state. Across the country, every covered shipment is represented at both its origin and its domestic destination; adding the national columns counts the same shipments twice. Use the official national row for the CFS total, rather than summing rounded or partly withheld state rows. 1 9
The displayed ratios and net weights are arithmetic on survey estimates. They are not international trade balances, production-minus-consumption measures, or tests that an origin–destination difference is statistically significant. For exports, the domestic destination can be the port of exit rather than the final buyer. 3 9 11
Why do value and weight give different answers?
Rank the states by what their freight is worth and then by what it weighs, and almost nothing stays put. Within the same 47-state group in the 2022 CFS, only Illinois and Pennsylvania have identical value and weight ranks. Seven states move ten places or more, and the median absolute rank gap is four places; these are rankings of published estimates, not significance tests. 1
The rank gap
We ranked each state twice within the same group of 47—once by shipment value, once by shipment weight—and calculated weight rank minus value rank. A negative gap means a state is placed higher on the weight list than on the value list. A positive gap means it is placed higher on the value list. The gap describes those two rankings; it does not identify a state’s commodity mix. 1
Matched ranks and origin cargo value per short ton, 2022 CFS
| State | Value rank | Weight rank | Gap | $/ton |
|---|---|---|---|---|
| Wyoming | 46 | 24 | −22 | 153 |
| West Virginia | 37 | 21 | −16 | 365 |
| Louisiana | 17 | 4 | −13 | 738 |
| North Dakota | 40 | 28 | −12 | 364 |
| Missouri | 19 | 10 | −9 | 1,242 |
| Iowa | 25 | 17 | −8 | 1,011 |
| Massachusetts | 18 | 31 | +13 | 2,863 |
| Washington | 16 | 29 | +13 | 2,655 |
| Oregon | 24 | 35 | +11 | 2,327 |
| Connecticut | 30 | 38 | +8 | 2,608 |
Source: Derived by Des Moines Dock Door Repair Research from 2022 Commodity Flow Survey, Table A7. Both ranks use the same 47 states with published origin value and weight, excluding DC; using different groups would confound the comparison. Verified September 15, 2026. 1
The rank gap and dollars-per-ton calculation answer different questions. Wyoming’s 22-place gap describes its position on two state lists; its $153 per short ton describes cargo value divided by weight. The state totals alone do not establish which commodities caused the gap or how much of those goods were produced in that state. 1 9
Cargo value per ton: what a ton is worth
Dividing shipment value by shipment weight gives cargo dollars per short ton—not physical density. The 2022 CFS national figure is $1,479. Twenty-three of the 47 states with published weights sit above it; DC is also above it but is not counted as a state. 1
Highest and lowest published origin cargo values per short ton, 2022 CFS
| Highest-value jurisdictions | $/short ton | Lowest-value jurisdictions | $/short ton |
|---|---|---|---|
| District of Columbia | 13,260 | Wyoming | 153 |
| Massachusetts | 2,863 | North Dakota | 364 |
| Nevada | 2,750 | West Virginia | 365 |
| Washington | 2,655 | South Dakota | 688 |
| Connecticut | 2,608 | Montana | 695 |
| New Hampshire | 2,345 | Louisiana | 738 |
| Oregon | 2,327 | Nebraska | 828 |
| California | 2,264 | Vermont | 952 |
Source: Derived by Des Moines Dock Door Repair Research from 2022 Commodity Flow Survey, Table A7. Verified September 15, 2026. 1
The District of Columbia is an outlier in this calculation and we are showing it rather than hiding it. Its 2022 CFS estimates were 292 thousand short tons—less than one four-hundredth of Iowa’s weight—and $3.872 billion of goods. Those inputs produce $13,260 per short ton; a small weight alone does not guarantee a high ratio. Among the 47 eligible states, the spread runs 18.7 times from Massachusetts to Wyoming. 1
Dollars per ton is not a shipping rate. Census defines shipment value as the net selling value of the goods at the point of shipment, excluding freight charges and excise taxes. Wyoming’s $153 per short ton is the average cargo value per unit of weight in its covered origin shipments. It says nothing about what a carrier charged to move them. 9
Which states are net shippers or net receivers in these estimates?
Divide a state’s origin estimate by its destination estimate and you get the origin-to-destination ratio used here. In the 2022 CFS, 23 of 47 states had a higher origin weight than destination weight, while 22 of all 50 states had a higher origin value than destination value. Among the same 47 states with weights in both directions, 17 had opposite value and weight balances; these classifications describe point estimates, not statistically established differences. 1
The 17 states where the two measures disagree
| State | Out/in by value | Out/in by weight | Reads as |
|---|---|---|---|
| Wyoming | 0.637 | 2.945 | Higher origin weight; higher destination value |
| West Virginia | 0.867 | 1.640 | Higher origin weight; higher destination value |
| Maine | 0.714 | 1.406 | Higher origin weight; higher destination value |
| Montana | 0.597 | 1.346 | Higher origin weight; higher destination value |
| Oklahoma | 0.941 | 1.114 | Higher origin weight; higher destination value |
| Mississippi | 0.938 | 1.079 | Higher origin weight; higher destination value |
| South Carolina | 0.976 | 1.033 | Higher origin weight; higher destination value |
| North Dakota | 0.717 | 1.021 | Higher origin weight; higher destination value |
| Virginia | 0.864 | 1.001 | Higher origin weight; higher destination value |
| Connecticut | 1.217 | 0.608 | Higher origin value; higher destination weight |
| Ohio | 1.111 | 0.859 | Higher origin value; higher destination weight |
| Massachusetts | 1.142 | 0.902 | Higher origin value; higher destination weight |
| North Carolina | 1.095 | 0.938 | Higher origin value; higher destination weight |
| Georgia | 1.041 | 0.941 | Higher origin value; higher destination weight |
| California | 1.047 | 0.950 | Higher origin value; higher destination weight |
| Pennsylvania | 1.022 | 0.973 | Higher origin value; higher destination weight |
| Oregon | 1.299 | 0.990 | Higher origin value; higher destination weight |
Source: Derived by Des Moines Dock Door Repair Research from 2022 Commodity Flow Survey, Tables A7 and A8. A ratio above 1.0 means the published origin estimate exceeds the destination estimate on that measure. Both include intrastate shipments; these are not international export/import ratios. Verified September 15, 2026. 1
Nine states have higher origin weight while destination value is higher. Eight have the reverse pattern. Wyoming’s weight ratio is 2.945 and its value ratio 0.637; Connecticut’s are 0.608 and 1.217. The arithmetic is reproducible, but these totals do not by themselves tell us which commodities, buyers or industries caused the differences. 1
Among states with both weights published, the largest positive origin-minus-destination differences in the 2022 CFS were Wyoming at +119,062 thousand short tons, Illinois at +89,129 and West Virginia at +76,091. The largest negative differences were Texas at −116,643, Ohio at −69,554 and Florida at −57,202. Texas had the largest published state origin and destination weight estimates, but not the largest positive net difference. 1
What do these numbers measure—and what do they leave out?
The 2022 Commodity Flow Survey sampled roughly 165,000 business establishments; it is not a count of every truck or every shipment. It covers specified mining, manufacturing, wholesale, warehousing and distribution, and selected retail and service establishments. Its coverage excludes direct farm-origin shipments and other out-of-scope activities, and its published totals exclude crude petroleum; domestic legs of imported goods can be included after they pass through an in-scope sampled establishment. 2 3 11 14
Three definitions do most of the work on this page.
Shipment value is the net selling price of the goods at shipment, excluding freight charges and excise taxes. It is not freight revenue, not transportation-industry GDP, and not what anyone paid a carrier. 9
A ton here is a short ton — 2,000 pounds. Census reports weight in thousands of short tons. 9
Origin and destination totals both include intrastate freight. A load that leaves a Cedar Rapids plant for a Des Moines warehouse counts in Iowa's origin row and Iowa's destination row. That is why the two columns must not be summed as distinct shipments. For an export, the domestic destination can be the U.S. port of exit, not the final foreign buyer. 3 9
What the survey does not capture is just as important. A Nebraska-to-Illinois shipment passing through Iowa does not appear in Iowa’s origin or destination row merely because its route crosses the state. Shipments originating at farms, construction sites and most service establishments are outside CFS coverage; imports are not comprehensively captured, although a later domestic shipment from an in-scope establishment can be included. And because goods can be shipped by a producer, then a wholesaler, then a distribution centre, the same physical goods can be counted in several shipment legs as they move down a supply chain. 9 11 14
CFS or FAF: which dataset answers your question?
CFS and FAF are two major federal freight products, and they are not interchangeable. The Commodity Flow Survey estimates shipments from its covered industries; the Freight Analysis Framework starts with CFS and integrates other sources to estimate a broader set of freight movements, including foreign trade. BTS says CFS typically supplies about 70% of FAF flows by value, while a separate study of 2017 domestic flows found state CFS coverage of 35%–80% of FAF outbound weight and 38%–83% of inbound weight—not measured 2022 coverage percentages. 3 7 15
CFS and FAF: scope, vintage and geography
| Comparison | Commodity Flow Survey | Freight Analysis Framework |
|---|---|---|
| What it is | A shipper survey, roughly 165,000 establishments | A model that integrates CFS with other sources |
| Current benchmark | 2022 data released June 26, 2025; print publication January 2026 | FAF6.0, base year 2022 |
| Scope | Mining, manufacturing, wholesale, warehousing, selected retail and services | All sectors including agriculture, construction, services and foreign trade |
| Includes imports? | Not comprehensively; domestic legs can be included through an in-scope sampled establishment | Integrates international trade and other sources |
| Value basis | Current dollars for the stated survey year; 2022 figures use 2022 dollars | FAF6 benchmark values use 2022 dollars; check the release and variable for later-year values |
| Geography | 50 states, DC and 134 CFS areas; a separate experimental product uses 329 subareas for truck and ground-parcel flows | FAF6 state and regional flows; the separately published experimental county product is based on FAF5.6.1 |
| Best for | Industry-scoped survey estimates with published uncertainty | Broader estimated freight activity, with source and modeling limits |
Source: U.S. Census Bureau 2022 Commodity Flow Survey program materials; Bureau of Transportation Statistics Freight Analysis Framework page dated August 31, 2026, and FAF FAQs page dated July 31, 2026. Compiled by Des Moines Dock Door Repair Research, verified September 15, 2026. 2 4 6 7 10 12 13 14
One definitional trap sits between them and it catches careful people. In FAF's summary tables, "From" and "To" exclude intrastate movements — those sit in a separate "Within" category. In the CFS state tables on this page, origin and destination include intrastate freight. A FAF "From Iowa" figure and a CFS "Iowa origin" figure are therefore measuring different things before you account for anything else. BTS defines these summary-table labels on its FAF FAQs page. They should not be generalized to every custom query of FAF’s underlying origin–destination files. 7
The numerical state ledger on this page uses CFS estimates only. We did not reproduce the FAF6 state-flow records, so no FAF state total appears in our table. The official FAF product is the separate source for broader freight estimates including foreign trade and sectors outside CFS coverage. 6
What are three ways a freight statistic can go wrong?
Distance definitions, detailed truck categories and ton-mile availability all changed between the 2017 and 2022 products. Each can produce a misleading comparison even when the copied figures are correct. The differences below come from the agencies’ own documentation. 1 4 5 11 13
The distance drop is not a like-for-like decline
The 2022 survey reports a mean shipment distance of 552 miles against 679 miles in 2017, with a published change of −18.8% in Table A1b. The two numbers measure different things: 2022 uses great-circle distance, which does not follow transport routes, while 2012 and 2017 used GeoMiler routed distances. The published percentage is transcribed from the table; it is not recalculated from its rounded mean-mile figures. 1 5 11
BTS is explicit about this in its own data portal: the fields were kept separate “to discourage direct comparisons between these values.” The figures do not establish that actual freight routes shortened by 18.8%, nor do they quantify how much of the apparent change comes from method versus shipment patterns. 5
The detailed truck categories changed
For the first time in 2022, the survey published estimates for customer pick-up, meaning a shipment reported as collected by the customer. This category accounts for an estimated 1,389,653 thousand short tons—11.4% of CFS national weight—and $1,018,874 million of shipment value. It is the estimate category that is new, not the activity of customers collecting goods. 1 11
Census included customer pick-up within single-mode truck in 2022; the 2017 truck category comprised for-hire and company-owned truck. Census marks the detailed truck-mode percentage changes as not comparable, while still publishing a −6.2% change for aggregate truck weight in Table A1b. The source’s distinction matters: preserve its aggregate figure and footnote, but do not present the detailed truck categories as unchanged series or infer the size of a behavioral change from the reclassification alone. 1 11
Ton-miles are absent from the 2022 CFS
A ton-mile represents one short ton moved one mile; shipment ton-miles combine weight with distance. The 2017 CFS published that measure, but the 2022 CFS does not estimate it, as the 2022 subarea methodology states explicitly. Multiplying a state’s total tons by its average distance per shipment does not reconstruct ton-miles: that average is not supplied as a ton-weighted distance. 4 18
FAF5 provides weight, value and activity, including ton-miles, on a 2017 benchmark. The FAF6 User’s Guide explicitly says ton-miles are not available in the initial release and are planned for a later release—this is not an inference from a missing label. As checked September 15, 2026, the current FAF product page identifies FAF6.0. A ton-mile figure drawn from FAF5 must retain its actual reference year and 2017 benchmark; the benchmark year is not necessarily the year of an annual estimate. 6 13 17
How does freight move by mode and distance?
Truck shipments dominate the 2022 CFS on both measures: 68.1% of estimated weight and 73.5% of value. Shipments with great-circle distances below 50 miles account for 56.4% of weight, and those below 250 miles account for a calculated 78.9%. Those are origin-to-destination distance bands, not proof that the actual transport routes were that short. 1
Selected U.S. freight modes in the 2022 CFS
| Mode | Value ($M) | Share of value | Short tons (thousands) | Share of weight | Avg. GCD miles |
|---|---|---|---|---|---|
| Truck (all, incl. customer pick-up) | 13,222,965 | 73.5% | 8,293,501 | 68.1% | 220 |
| Rail | 568,541 | 3.2% | 1,456,515 | 12.0% | 614 |
| Water (all) | 171,131 | 1.0% | 435,378 | 3.6% | 409 |
| Air (incl. truck and air) | 155,933 | 0.9% | 5,212 | 0.0% | 1,254 |
| Pipeline | 589,646 | 3.3% | 799,759 | 6.6% | S |
| Parcel, USPS or courier | 2,403,012 | 13.4% | 61,657 | 0.5% | 776 |
| Truck and rail | 587,664 | 3.3% | 841,574 | 6.9% | 747 |
| Unknown | 208,186 | 1.2% | 101,705 | 0.8% | 471 |
Source: U.S. Census Bureau and Bureau of Transportation Statistics, 2022 Commodity Flow Survey, Table A1a. Rows are drawn from the single-mode and multiple-mode groupings and are not a complete partition of the total; smaller categories are omitted. Pipeline estimates exclude crude petroleum; S means its mean-distance estimate was withheld. Air’s displayed 0.0% weight share is the source’s Z, a nonzero share rounding to zero at this precision. Parcel/courier is within multiple modes. Verified September 15, 2026. 1
Parcel is a clear illustration of why unit choice matters. Its displayed share of CFS shipment value is 13.4%, against 0.5% of weight—roughly 27 to one when those rounded shares are divided. That is a comparison of shares, not the price of a parcel or a dollars-per-ton estimate. Rail reverses the pattern at 12.0% of CFS weight and 3.2% of value. 1
Warehouses as shippers
The survey treats warehousing and storage establishments as shippers in their own right. In 2022, the published NAICS 4931 warehousing and storage group originated an estimated $1,347,716 million of shipments weighing 305,651 thousand short tons—up 14.0% in nominal value and 11.2% in weight from 2017. The table’s footnote says NAICS 484 is grouped with NAICS 4931 for tabulation and publication; the superscript footnote number is not part of the NAICS code. Average distance was 687 routed miles in 2017 and 368 great-circle miles in 2022, so those means cannot isolate a change in actual shipping distances. 1
Source: U.S. Census Bureau and Bureau of Transportation Statistics, 2022 Commodity Flow Survey, Tables A6a and A6b. Verified September 15, 2026.
What do the Iowa figures and Des Moines geography show?
Iowa originated an estimated 258.3 million short tons worth $261.2 billion in the 2022 CFS and received 234.8 million short tons worth $233.4 billion. It was one of 14 of the 47 eligible states with higher origin than destination estimates on both measures. Iowa’s origin cargo value was $1,011 per short ton against the CFS national $1,479, and its matched weight rank was eight places higher than its value rank; these are comparisons of estimates, not tests of the differences. 1
Iowa freight profile, 2022
| Measure | Value |
|---|---|
| Value shipped | $261,183 million |
| Tons shipped | 258,251 thousand |
| Value received | $233,435 million |
| Tons received | 234,825 thousand |
| Net tonnage balance | +23,426 thousand tons |
| Dollars per ton shipped | $1,011 |
| Average GCD per originating shipment | 478 miles |
| Share of CFS national shipment value | 1.45% |
| Share of CFS national shipment weight | 2.12% |
| Rank by value (of the same 47 states) | 25th |
| Rank by weight (of the same 47 states) | 17th |
Source: U.S. Census Bureau and Bureau of Transportation Statistics, 2022 Commodity Flow Survey, Tables A7 and A8. Shares, ratios, dollars per ton and matched ranks derived by Des Moines Dock Door Repair Research. Verified September 15, 2026. 1
Iowa is not alone in that pattern. Five of its six neighbouring states also have higher origin than destination weight estimates in the 2022 CFS. South Dakota is the exception in the comparison below. 1
Iowa and bordering states, 2022
| State | Tons shipped (K) | Out/in by weight | $/ton | Avg. GCD miles out |
|---|---|---|---|---|
| Illinois | 608,162 | 1.172 | 1,455 | 473 |
| Minnesota | 293,581 | 1.188 | 1,411 | 692 |
| Missouri | 294,513 | 1.285 | 1,242 | 555 |
| Iowa | 258,251 | 1.100 | 1,011 | 478 |
| Wisconsin | 221,741 | 1.046 | 1,784 | 479 |
| Nebraska | 174,874 | 1.148 | 828 | 546 |
| South Dakota | 77,316 | 0.960 | 688 | 395 |
Source: U.S. Census Bureau and Bureau of Transportation Statistics, 2022 Commodity Flow Survey, Tables A7 and A8. Ratios and dollars per ton derived by Des Moines Dock Door Repair Research. Verified September 15, 2026. 1
A Des Moines freight figure is not a Polk County figure
The main CFS tables report regional figures for CFS areas rather than a comprehensive county-by-county table. The 2022 geography has 134 CFS areas; a separate experimental truck and ground-parcel product uses 329 subareas. Des Moines–Ames–West Des Moines, IA, CFS area 218, was added for 2022 and covers the ten counties below—not Polk County alone. 4 8 10 11
Counties in the 2022 Des Moines–Ames–West Des Moines CFS area (218)
| County | In the Des Moines–Ames–West Des Moines CFS area |
|---|---|
| Boone | Yes |
| Dallas | Yes |
| Guthrie | Yes |
| Jasper | Yes |
| Madison | Yes |
| Mahaska | Yes |
| Marion | Yes |
| Polk | Yes |
| Story | Yes |
| Warren | Yes |
Source: U.S. Census Bureau, 2022 Commodity Flow Survey Methodology, Table 13, printed page 23. The ten county names and new-area designation were read directly against the primary-source table. Verified September 15, 2026. 11
The practical consequence is simple. A freight total for the Des Moines CFS area describes all ten counties and cannot be relabeled as Polk County. No Polk County or Des Moines-area numerical freight total is published in this compilation. BTS does provide a separate experimental county product based on FAF5.6.1, but we have not reproduced its individual county-flow records; the ten-county list above verifies geography, not local tonnage. 11 12
What changed in the freight data available in 2026?
The relevant 2026 updates are a new print publication and a newer FAF benchmark—not newly observed 2026 shipments. The 2022 CFS data were first released on June 26, 2025, its print report was issued in January 2026, and the current BTS FAF page identifies FAF6.0 with a 2022 base year. The FAF page’s August 31, 2026 update date is a documentation date, not a date on which these shipments occurred. 1 6 14
That has three practical effects. Publication year cannot substitute for reference year: a 2025 page can contain 2022 CFS data, while a recently updated page can still show an older dataset. FAF regional geographies changed between benchmarks, so comparisons across FAF5 and FAF6 need the relevant geography definitions. And FAF6’s 2022-dollar values cannot be treated as having the same price basis as FAF5’s 2017-dollar values merely because both are labeled constant dollars. 6 7 8 13 14 17
None of that makes older figures wrong. It makes them dated in a way that is easy to miss, because the labels look identical.
How was this freight dataset assembled and checked?
The state ledger joins four published federal tables: origin estimates, destination estimates and their two reliability tables. Inputs were manually transcribed and checked against the primary publication; derived fields were then rebuilt from those inputs. Every count, ratio, share and ranking describes the published estimates rather than a new survey or a statistical-significance test. 1
What we collected
Every published numerical shipment estimate reproduced here comes from 2022 Commodity Flow Survey, EC22TCF-US, 2022 Economic Census: Transportation, issued by the U.S. Census Bureau and Bureau of Transportation Statistics in January 2026. We read Table A7 (origin state, printed page 19), Table A8 (destination state, page 20), Tables A1a and A1b (modes and national comparisons), Table A2a (distance), and Tables A6a and A6b (NAICS industry groups) against the primary PDF on September 15, 2026. Tables B-A7 and B-A8, printed pages 92–93, supply the state coefficients of variation and were checked against their page images in the same pass. 1
Those are printed page numbers. In the full PDF, A7 and A8 are pages 29 and 30, while B-A7 and B-A8 are pages 102 and 103. The file has 163 PDF pages. This was a manual source-table transcription and verification, not an API export, a scrape of a secondary summary, or a survey conducted by this site. 1
Definitions, release dates, source availability and the Des Moines county membership come from the separate agency documents identified in the source list. The county list was checked directly against Table 13 of the Census methodology; no county freight total was inferred from it. 6 11 12 13 14
What we derived, and how
Four calculated columns appear in the main display: origin cargo value per ton, the two origin-to-destination ratios, and net weight. The download also contains destination cargo value per ton, national origin shares and matched state ranks. All calculations start with the published integer estimates, before display rounding.
Formulas used in the version 1.2 freight ledger
| Calculation | Formula and interpretation |
|---|---|
| Origin or destination cargo dollars per short ton | (Value in millions of dollars ÷ weight in thousands of short tons) × 1,000. This is cargo value, not freight charges. |
| Origin-to-destination value ratio | Origin value ÷ destination value. Both totals include within-state shipments. |
| Origin-to-destination weight ratio | Origin weight ÷ destination weight. Both totals include within-state shipments. |
| Net weight, thousand short tons | Origin weight − destination weight. A descriptive difference, not an international trade balance. |
| State share of national origin value or weight | State origin estimate ÷ the corresponding official national estimate × 100. The denominator is not the sum of only the published state weights. |
| Matched rank gap | Weight rank − value rank, using the same 47 states for both ranks. A negative number means a better numerical position on the weight list. |
| Opposite balance classification | The unrounded origin-minus-destination value difference and the unrounded origin-minus-destination weight difference have opposite signs. |
Source: Des Moines Dock Door Repair Research calculations from U.S. Census Bureau and Bureau of Transportation Statistics, 2022 CFS, Tables A7 and A8; units and shipment value follow the Census glossary. Verified September 15, 2026. 1 9
Matched ranks include only the 47 states with published origin value and weight. DC is retained in the table and files but is not a state and is excluded from these ranks. The value-only top-ten table compares all 50 states; the weight top ten and all rank-gap statements use the 47 eligible states. There are no ties in the source values used for these two matched rankings, and no comparison is made against different-sized cohorts.
The “17 states” finding uses those same 47 states because origin and destination weights are published for the same eligible set. Nine have higher origin weight and higher destination value; eight have higher origin value and higher destination weight. The difference signs are calculated before ratios are rounded. Fourteen states have higher origin estimates on both measures. These classifications are not confidence statements about the underlying shipment populations. 1
For the under-250-mile finding, we summed the three Table A2a weight estimates—6,861,767, 1,331,412 and 1,414,087 thousand short tons—and divided the resulting 9,607,266 by the official 12,169,793 thousand-short-ton national total. The result is 78.943545%, displayed as 78.9%. This is a great-circle distance calculation, not a routed-mile calculation. 1
For example, Iowa’s origin cargo value per short ton is (261,183 ÷ 258,251) × 1,000 = approximately $1,011. Its origin-to-destination weight ratio is 258,251 ÷ 234,825 = approximately 1.100. Its net weight is 258,251 − 234,825 = +23,426 thousand short tons. The script exports noninteger derived fields to six decimal places; the page rounds dollar-per-ton figures to whole dollars, ratios to three decimals and shares to the stated one or two decimals. 1
Two reconciliation checks
First, we compared the sum of the 51 jurisdiction value estimates with the published national estimate. Origins total $17,996,783 million, against the official $17,996,782 million—a $1 million difference. Destinations total $17,996,776 million, or $6 million below the official national figure. Those small differences are consistent with the source’s rounding note. Passing this aggregate check does not by itself prove that every cell is correct; the source-page checks are separate. 1
Second, the published state weights cannot sum to the national estimate because Alaska, Arizona and New Mexico are withheld. The 48 jurisdiction rows with origin weight total 11,603,900 thousand short tons, against the official 12,169,793; the arithmetic gap is 565,893 thousand short tons, or 4.65%. The destination gap is 608,002 thousand short tons, or 5.00%. These are reconciliation gaps only—not verified combined estimates for the three withheld states—and we do not use them to fill any suppressed cell. Census warns that estimates derived from suppressed-table residuals can be misleading. 1 11
How uncertainty is reported
These are survey estimates, not complete counts. A coefficient of variation, or CV, is the standard error divided by the estimate, expressed as a percentage. For the 2022 CFS, the published variability measures incorporate noise infusion as well as sampling variability; they are not confidence levels or probabilities that a figure is correct. 11
The following table carries the source CVs alongside the reference. No confidence interval for a ratio, share, rank, net difference or classification count has been constructed here. Those derived measures can depend on covariance and other features that a single estimate’s CV does not resolve; neither a small rank gap nor a 22-place gap alone establishes statistical significance.
State estimate reliability, 2022 CFS
| State or jurisdiction | Origin value CV (%) | Origin weight CV (%) | Origin distance CV (%) | Destination value CV (%) | Destination weight CV (%) | Destination distance CV (%) |
|---|---|---|---|---|---|---|
| Alabama | 5.1 | 7.0 | 11.1 | 3.5 | 6.7 | 5.7 |
| Alaska | 11.4 | S | 32.5 | 10.8 | S | 2.9 |
| Arizona | 5.7 | S | 12.7 | 4.8 | S | 9.1 |
| Arkansas | 6.0 | 11.5 | 5.6 | 5.3 | 8.8 | 5.8 |
| California | 6.6 | 12.1 | 7.7 | 5.6 | 9.2 | 5.6 |
| Colorado | 3.6 | 8.5 | 7.6 | 3.6 | 7.6 | 9.1 |
| Connecticut | 8.6 | 10.8 | 14.7 | 4.0 | 42.9 | 8.0 |
| Delaware | 17.8 | 16.1 | 45.7 | 6.7 | 14.8 | 8.1 |
| District of Columbia | 31.1 | 36.9 | 24.7 | 6.1 | 19.0 | 12.4 |
| Florida | 3.9 | 7.2 | 10.6 | 3.3 | 6.7 | 6.2 |
| Georgia | 3.8 | 8.0 | 4.9 | 4.4 | 7.1 | 6.9 |
| Hawaii | 15.0 | 22.3 | 16.1 | 10.3 | 18.7 | 9.8 |
| Idaho | 8.2 | 12.1 | 15.0 | 6.6 | 11.2 | 6.2 |
| Illinois | 3.5 | 8.5 | 5.5 | 3.5 | 9.0 | 8.3 |
| Indiana | 9.4 | 9.0 | 4.2 | 5.3 | 5.9 | 7.4 |
| Iowa | 3.5 | 6.6 | 6.5 | 4.9 | 6.9 | 4.8 |
| Kansas | 4.9 | 7.2 | 7.8 | 4.7 | 7.6 | 3.5 |
| Kentucky | 6.2 | 8.9 | 5.9 | 4.2 | 13.2 | 8.6 |
| Louisiana | 7.7 | 8.9 | 15.0 | 7.9 | 9.2 | 3.9 |
| Maine | 5.9 | 12.9 | 11.5 | 11.0 | 12.1 | 5.9 |
| Maryland | 5.9 | 7.3 | 11.7 | 2.6 | 11.2 | 8.6 |
| Massachusetts | 13.1 | 11.4 | 6.8 | 8.5 | 10.5 | 11.8 |
| Michigan | 4.3 | 10.2 | 7.8 | 3.2 | 5.0 | 7.7 |
| Minnesota | 8.0 | 7.6 | 5.1 | 5.9 | 9.1 | 5.4 |
| Mississippi | 10.5 | 35.3 | 18.3 | 4.7 | 36.6 | 7.8 |
| Missouri | 12.1 | 8.4 | 9.7 | 5.2 | 5.2 | 6.6 |
| Montana | 13.1 | 22.4 | 17.1 | 7.3 | 19.3 | 4.5 |
| Nebraska | 6.5 | 12.4 | 12.3 | 4.2 | 5.8 | 3.9 |
| Nevada | 10.1 | 14.9 | 9.2 | 5.3 | 16.6 | 4.7 |
| New Hampshire | 7.3 | 9.2 | 4.9 | 9.1 | 7.1 | 9.0 |
| New Jersey | 9.5 | 22.4 | 10.3 | 8.8 | 10.1 | 12.2 |
| New Mexico | 15.4 | S | 35.1 | 10.2 | S | 5.7 |
| New York | 7.6 | 7.2 | 16.9 | 4.1 | 5.9 | 13.0 |
| North Carolina | 3.9 | 10.3 | 6.1 | 3.6 | 9.0 | 5.6 |
| North Dakota | 12.0 | 32.1 | 14.6 | 7.2 | 32.2 | 4.3 |
| Ohio | 3.7 | 3.7 | 6.0 | 3.7 | 3.7 | 5.9 |
| Oklahoma | 5.7 | 9.5 | 11.6 | 5.7 | 8.5 | 5.8 |
| Oregon | 12.0 | 9.2 | 21.4 | 2.8 | 6.5 | 15.6 |
| Pennsylvania | 3.3 | 10.9 | 4.2 | 2.7 | 6.0 | 8.7 |
| Rhode Island | 10.7 | 15.1 | 15.3 | 5.5 | 11.1 | 11.5 |
| South Carolina | 6.2 | 10.6 | 12.1 | 4.1 | 9.2 | 5.5 |
| South Dakota | 4.7 | 10.2 | 12.6 | 8.0 | 16.5 | 3.9 |
| Tennessee | 8.4 | 11.0 | 8.7 | 3.9 | 10.7 | 7.8 |
| Texas | 6.5 | 6.7 | 7.4 | 4.7 | 6.2 | 7.6 |
| Utah | 16.0 | 31.2 | 6.3 | 12.2 | 17.8 | 7.4 |
| Vermont | 7.3 | 29.8 | 19.3 | 8.3 | 23.4 | 13.8 |
| Virginia | 5.7 | 10.0 | 6.1 | 2.2 | 6.4 | 7.0 |
| Washington | 6.2 | 8.2 | 40.4 | 6.1 | 10.5 | 26.4 |
| West Virginia | 12.7 | 16.1 | 10.3 | 11.6 | 22.4 | 10.0 |
| Wisconsin | 3.0 | 7.6 | 8.4 | 3.9 | 4.8 | 5.6 |
| Wyoming | 10.1 | 27.9 | 20.8 | 9.4 | 20.6 | 3.6 |
| United States | 1.3 | 1.9 | 2.8 | 1.3 | 1.9 | 2.8 |
Source: U.S. Census Bureau and Bureau of Transportation Statistics, 2022 CFS, Tables B-A7 and B-A8, printed pages 92–93 (PDF pages 102–103). Values are published coefficients of variation in percent; S identifies a withheld weight estimate and its unavailable CV. Verified directly against the primary tables on September 15, 2026. 1 11
Reproducibility and file contents
The CSV and JSON contain the same 51 records. Suppressed numeric inputs are empty in CSV and null in JSON; separate status fields retain the source’s S. A suppressed weight produces no dollars-per-ton value, weight ratio, net weight or matched rank. DC’s matched ranks are also null because it is excluded from the state cohort, not because its estimates are missing.
The version 1.2 reproducibility package includes the manual source transcription; supplementary national, mode, distance and warehousing inputs; the county-geography crosswalk; a data dictionary; the source register; calculated findings; and the Python build script. It needs only Python’s standard library and the included input files. The script reproduces the derived columns and reconciliation checks offline; it does not fetch or re-verify live agency releases.
Source-record validation checks jurisdiction uniqueness, expected suppressions, state-cohort sizes, eligible rank inputs, and successful CSV/JSON reproduction. The calculations can therefore be rerun from the same published inputs rather than from rounded values copied out of this page.
Verification record and refresh rules
Version 1.2—September 15, 2026: the source estimates and state CVs were checked; the state-only ranking cohort, derived figures, geography reference and downloadable files were rebuilt. The data year remains 2022.
The verification date changes only after the underlying source material is checked again. New Census corrections or CFS releases trigger a recheck of the source cells and calculations; a new FAF release triggers a recheck of the benchmark and ton-mile availability statements; revised geographic documentation triggers a county-membership check. A link check or copy edit alone does not make the data newly verified. No release is relabeled as current-year observations simply because this page is maintained in that year.
What are the limitations of these freight statistics?
The dataset describes shipments covered by the 2022 CFS, not every freight movement or the quantity of unique goods in the economy. Missing weights, sampling uncertainty, scope differences and changed distance definitions limit what the comparisons establish. In particular, this page does not turn point-estimate ranks or balance signs into tests of statistical significance. 1 9 11
This is a sample, not a census of freight. The 2022 survey sampled roughly 165,000 establishments. The published estimates are subject to sampling and nonsampling error; the CVs reproduced above quantify reported relative variability, not every possible source of error. 3 11
It does not cover all U.S. freight. Direct farm-origin shipments, construction, most services and shipments originating in U.S. territories are outside its coverage; published national totals exclude crude petroleum. Imports are not comprehensively captured, but later domestic legs through in-scope establishments can be included. The 35%–80% state outbound-weight coverage range reported by BTS applies to a comparison of 2017 domestic flows, not a verified 2022 coverage rate. 3 11 14 15
Three state weights are missing. Alaska, Arizona and New Mexico are withheld in both directions. Those states are excluded from weight and matched rankings, dollars-per-ton calculations and weight ratios; no suppressed estimate is imputed. 1
Freight can be counted more than once. A good shipped from a factory to a wholesaler, then to a distribution centre, then to another customer can appear in three shipment legs when those origin establishments are in scope. The survey measures shipments, not unique goods; summing their cargo values does not produce GDP. 9 11
Through traffic is not identified by these state totals. Freight crossing a state without an origin or domestic destination there does not appear in that state’s rows merely because it passes through. The table does not supply vehicle counts, traffic volumes, loading-dock activity or repair demand, and no such quantity is inferred here. 1 9
Values are not inflation-adjusted. The 24.0% rise in shipment value between 2017 and 2022 is in current dollars and includes price increases. It is not a 24% rise in the quantity of goods moved — the published weight estimate was 2.4% lower. Census’s June 2025 release characterized national tonnage as “virtually unchanged”; the negative percentage is a change in the point estimates, not a decline independently tested by this compilation. 1 14
2022 is a fixed frame. These estimates describe the 2022 survey year. The data were initially released in June 2025, the print report followed in January 2026, and this compilation was verified on September 15, 2026. Census’s May 2026 information-collection notice identifies 2027 as the next planned survey year; it does not provide 2027 freight results. 1 14 16
No local freight total is inferred. The Des Moines section verifies the membership of a ten-county statistical area. It does not allocate Iowa’s shipments by population, warehouse count or any other proxy, and it does not present the regional boundary as a measured Polk County freight figure.
Which figures are verified, and which are not included?
The state estimates, their CVs, and the ten-county Des Moines CFS definition have been checked directly against primary sources. County and regional numerical freight totals are not included in this release. The record below distinguishes verified documentation from data that this compilation does not reproduce.
Coefficients of variation by state—verified. Tables B-A7 and B-A8 were read directly and their six CV fields per jurisdiction are included in the reliability table and downloads. Those source CVs do not by themselves establish significance for the derived rankings and origin–destination comparisons. 1 11
The Census methodology and Des Moines boundary—verified. Table 13 explicitly names Boone, Dallas, Guthrie, Jasper, Madison, Mahaska, Marion, Polk, Story and Warren as the new 2022 Des Moines–Ames–West Des Moines CFS area. No secondary geography match is substituted for that source. 11
Any Polk County freight total—not included. BTS publishes an experimental county-level product based on FAF5.6.1. We verified that product’s identity and documentation but did not reproduce its individual county-flow records, so there is no numerical Polk County freight estimate on this page. That is a boundary of this compilation, not a claim that no official county data exist. 12
Freight totals for the Des Moines CFS area or its subareas—not included. The 134-area CFS geography and the experimental 329-subarea truck/ground-parcel product are different geographic products. The verified county membership is published here, but no numeric area total or subarea allocation is presented as Polk County freight. 4 8 10 11
FAF6 ton-mile availability—verified. Table 5 of the FAF6 User’s Guide says ton-miles are unavailable in the initial release and planned for a later FAF6 release. The currently identified release on the BTS product page was FAF6.0 when checked September 15, 2026. This replaces an inference from a release description with the product’s explicit statement. 6 13
How is this page cited?
The reference below identifies this compilation, its data year and verification date. The underlying estimates belong to the U.S. Census Bureau and the Bureau of Transportation Statistics; Des Moines Dock Door Repair Research produced the join, calculations and explanatory reference. 1
Publication: Des Moines Dock Door Repair Research
Page: “Freight Statistics by State: What Every U.S. State Ships and Receives”
Canonical URL: https://desmoinesdockdoorrepair.com/research/freight-statistics-by-state/
Data year: 2022
Compilation version: 1.2
Last verified: September 15, 2026
Des Moines Dock Door Repair Research. “Freight Statistics by State: What Every U.S. State Ships and Receives.” Version 1.2. 2022 CFS data. Last verified September 15, 2026.
Underlying source attribution: U.S. Census Bureau and Bureau of Transportation Statistics, 2022 Commodity Flow Survey, EC22TCF-US, January 2026, Tables A7, A8, B-A7 and B-A8. The remaining source tables, exact page locations and primary URLs appear below. This site is the source of the compilation and derived comparisons, not the original producer of the federal estimates. 1
What else do readers ask about state freight statistics?
The answers below use the same 2022 CFS scope, units and geographic definitions as the tables. They separate cargo value from shipping prices, source year from verification year, and state shipment endpoints from routes through a state. 1 9
Which state moves the most freight?
It depends on the unit and the dataset. In the 2022 CFS, Texas had the largest published state origin-weight estimate at 1.666 billion short tons, 13.7% of the CFS national total; California had the largest state origin-value estimate at $2.061 trillion, 11.5%. The weight comparison excludes the three states with withheld weights, but their value estimates are published and included in the all-state value comparison. These are rankings of estimates, not significance tests. 1
Are these 2026 freight numbers?
No. They are estimates for 2022, first released in June 2025, printed in January 2026 and checked here on September 15, 2026. Census’s current survey-planning notice identifies 2027 as the next planned CFS reference year. 1 14 16
Why are some state tonnage figures blank?
Census withheld the origin and destination weights for Alaska, Arizona and New Mexico because the estimates did not meet its publication standards. A withheld figure is not zero. Those states are excluded from weight-based calculations and matched rankings; the downloadable files retain the suppression status. 1
Do these totals include freight that just passes through a state?
Not in that state’s origin or destination row solely because it passes through. Those rows identify where covered shipments begin and their domestic destinations; they do not measure pass-through traffic. For an export, the domestic destination can be the port of exit. 3 9
Is dollars per ton a shipping rate?
No. It is cargo value divided by weight, expressed here in dollars per short ton. Census defines shipment value as net selling value at origin, excluding freight charges and excise taxes, so the calculation cannot be used as a carrier price. 9
Can I add the shipped and received columns to get a state’s total freight?
Not as a total of distinct covered shipments. Both columns include freight that starts and finishes within the state, so adding them counts that freight twice. Keep origin and destination totals distinct, and use a properly defined origin–destination table when a measure of unique state-linked shipments is needed. 1 9
Why do CFS and FAF give different numbers for the same state?
Their scopes and tabulations differ. CFS estimates shipments from specified industries; FAF combines CFS and other sources for broader freight coverage. BTS says CFS typically supplies about 70% of FAF value, while the state outbound-weight coverage range of 35%–80% comes from a comparison of 2017 domestic flows, not 2022. FAF’s summary From and To categories also exclude Within movements, whereas the CFS origin and destination totals here include intrastate shipments. 3 7 15
Does the Des Moines figure cover Polk County?
No numerical Des Moines or Polk County freight total is published on this page. The 2022 Des Moines–Ames–West Des Moines CFS area includes ten counties: Boone, Dallas, Guthrie, Jasper, Madison, Mahaska, Marion, Polk, Story and Warren. An area total would cover all ten and cannot be relabeled as Polk County alone. 11
Where did ton-miles go?
The 2022 CFS does not estimate ton-miles, although the 2017 survey did. The FAF6 User’s Guide says ton-miles are unavailable in the initial release and planned for a later release. FAF5 supplies ton-mile estimates on a 2017 benchmark; any use of those figures needs its actual data year and release version, rather than treating the benchmark as the year of every annual estimate. 4 13 17 18
Why did average shipment distance fall so much between 2017 and 2022?
The published means use different methods: 2022 uses great-circle distance and 2017 uses routed network distance. BTS keeps those fields separate to discourage direct comparison. The figures do not identify how much of the apparent difference is caused by measurement versus changes in shipment patterns. 1 5 11
What are the primary sources?
The shipment estimates come from Census and BTS, and the remaining references document definitions, geography, methods and release status. All sources below were checked on September 15, 2026; the individual county-flow records are expressly outside this compilation. Printed page numbers and PDF page numbers are distinguished where they differ.
1. U.S. Census Bureau and Bureau of Transportation Statistics. 2022 Commodity Flow Survey, EC22TCF-US, 2022 Economic Census: Transportation. January 2026. Tables A1a–A1b (printed pages 5–6), A2a (7), A6a–A6b (16–18), A7–A8 (19–20), and B-A7–B-A8 (92–93).
Primary source: https://www.census.gov/content/dam/Census/library/publications/2022/econ/e22tcf-us.pdf
Verified: September 15, 2026.
2. U.S. Census Bureau. About the Commodity Flow Survey: survey purpose, scope and program design.
Primary source: https://www.census.gov/programs-surveys/cfs/about.html
Verified: September 15, 2026.
3. Bureau of Transportation Statistics. Commodity Flow Survey program page: 2022 survey sample and the separately dated 2017 CFS-to-FAF coverage comparison.
Primary source: https://www.bts.gov/cfs
Verified: September 15, 2026.
4. U.S. Census Bureau and Bureau of Transportation Statistics. The 2022 Commodity Flow Survey—Subarea Estimates: Methodology. October 2025. Scope of the experimental subareas and the explicit statement that 2022 CFS does not estimate ton-miles.
Primary source: https://www2.census.gov/data/experimental-data-products/commodity-flow-survey-subarea-estimates/2022/2022-commodity-flow-survey-subarea-estimates-methodology.pdf
Verified: September 15, 2026.
5. Bureau of Transportation Statistics. CFS Data Explorer, 2012–2022. Great-circle versus GeoMiler distance warning.
Primary source: https://cfsdata.bts.gov/
Verified: September 15, 2026.
6. Bureau of Transportation Statistics. Freight Analysis Framework. Current release identified as FAF6.0, with a 2022 base year; page updated August 31, 2026.
Primary source: https://www.bts.gov/faf
Verified: September 15, 2026.
7. Bureau of Transportation Statistics. FAF FAQs and Limitations. Coverage, From/To/Within definitions and geography comparisons; page updated July 31, 2026.
Primary source: https://www.bts.gov/faf/faqs
Verified: September 15, 2026.
8. U.S. Census Bureau. Commodity Flow Survey Geographies. Official geography documentation and files.
Primary source: https://www.census.gov/programs-surveys/cfs/technical-documentation/geographies.html
Verified: September 15, 2026.
9. U.S. Census Bureau. Commodity Flow Survey Glossary. Shipment value, short tons and shipment definitions.
Primary source: https://www.census.gov/programs-surveys/cfs/about/glossary.html
Verified: September 15, 2026.
10. U.S. Census Bureau. Commodity Flow Survey Subarea Estimates. Experimental product landing page; 2022 subarea estimates released September 26, 2025.
Primary source: https://www.census.gov/data/experimental-data-products/commodity-flow-survey-subarea-estimates.html
Verified: September 15, 2026.
11. U.S. Census Bureau. 2022 Commodity Flow Survey Methodology. Industry and geographic coverage, suppression, sampling variability, noise infusion, mode changes, and Table 13 (printed page 23) defining the new ten-county Des Moines CFS area.
Primary source: https://www2.census.gov/programs-surveys/cfs/technical-documentation/methodology/2022%20Commodity%20Flow%20Survey%20Methodology.pdf
Verified: September 15, 2026.
12. Bureau of Transportation Statistics. Experimental County-Level Estimates. Product based on FAF5.6.1; page updated August 18, 2025. Product documentation verified; individual county flow records are not reproduced here.
Primary source: https://www.bts.gov/faf/county
Verified: September 15, 2026.
13. Bureau of Transportation Statistics. Freight Analysis Framework Version 6 User’s Guide. Table 5, printed page 11 (PDF page 16): ton-miles are planned for a later FAF6 release and are not available in the initial release.
Primary source: https://faf.ornl.gov/faf6/data/FAF6%20User%20Guide.pdf
Verified: September 15, 2026.
14. U.S. Census Bureau. Census Bureau Reports Shipment of U.S. Goods Reached 12.2 Billion Tons and $18.0 Trillion. June 26, 2025. Initial 2022 CFS data release and explanation of domestic portions of imported shipments.
Primary source: https://www.census.gov/newsroom/press-releases/2025/cfs-shipments-of-goods.html
Verified: September 15, 2026.
15. Bureau of Transportation Statistics. Comparison of Commodity Flow Survey (CFS) and Freight Analysis Framework (FAF) for 2017 Domestic Freight Flows. May 10, 2022. Historical coverage study, not a 2022 coverage estimate.
Primary source: https://rosap.ntl.bts.gov/view/dot/62743
Verified: September 15, 2026.
16. U.S. Census Bureau. Commodity Flow Survey proposed information collection for the 2027 Economic Census. Federal Register notice 2026-10118, May 20, 2026. Next planned survey year, not a statement that 2027 results are available.
Primary source: https://www.federalregister.gov/documents/2026/05/20/2026-10118/agency-information-collection-activities-submission-to-the-office-of-management-and-budget-omb-for
Verified: September 15, 2026.
17. Bureau of Transportation Statistics. Freight Analysis Framework Version 5. Definition of weight, value and activity, including ton-miles, on a 2017 benchmark.
Primary source: https://www.bts.gov/faf/faf5
Verified: September 15, 2026.
18. U.S. Census Bureau. Transportation—Commodity Flow Survey: United States: 2017. Publication description and definition of ton-miles in the preceding survey.
Primary source: https://www.census.gov/library/publications/2017/econ/2017cfs.html
Verified: September 15, 2026.
By Des Moines Dock Door Repair Research. Last verified: September 15, 2026. Published estimates were checked against their primary sources; derived values were recalculated from those inputs. The verification date changes only when the underlying source material is checked again, not when the page is edited.
Des Moines Dock Door Repair Research is the independent research and reference section of desmoinesdockdoorrepair.com.